ABOVE: Scientists use high-tech microscopy tools to map the brain. © iStock, VladSt

When Ozgun Gokce was a child, his family’s television broke. Losing that TV prompted him to figure out why it went kaput. That initial curiosity led Gokce into a career of understanding why things break—specifically with disease. He is now a research scientist at the University of Bonn, where he investigates age-related neurological disorders and builds technologies to identify why and how brains degenerate.
In his latest foray into neuropathology, his lab developed a technique that merges multiplexed error-robust fluorescence in situ hybridization (MERFISH) with scanning electron microscopy (SEM). By tapping into both technologies, Gokce created spatial transcriptomics-correlated electron microscopy (STcEM), which links tissue sections with single-cell transcription and ultrastructural morphologies to render high-magnification cellular architecture with electron microscopy.1 He tested the new method on mice with demyelinating brain injury, which can trigger diseases such as multiple sclerosis or Alzheimer's disease, and produced global maps of the ailing brains.
See Also "Context Is Key: Unlocking Tissue Complexity with Spatial Biology"
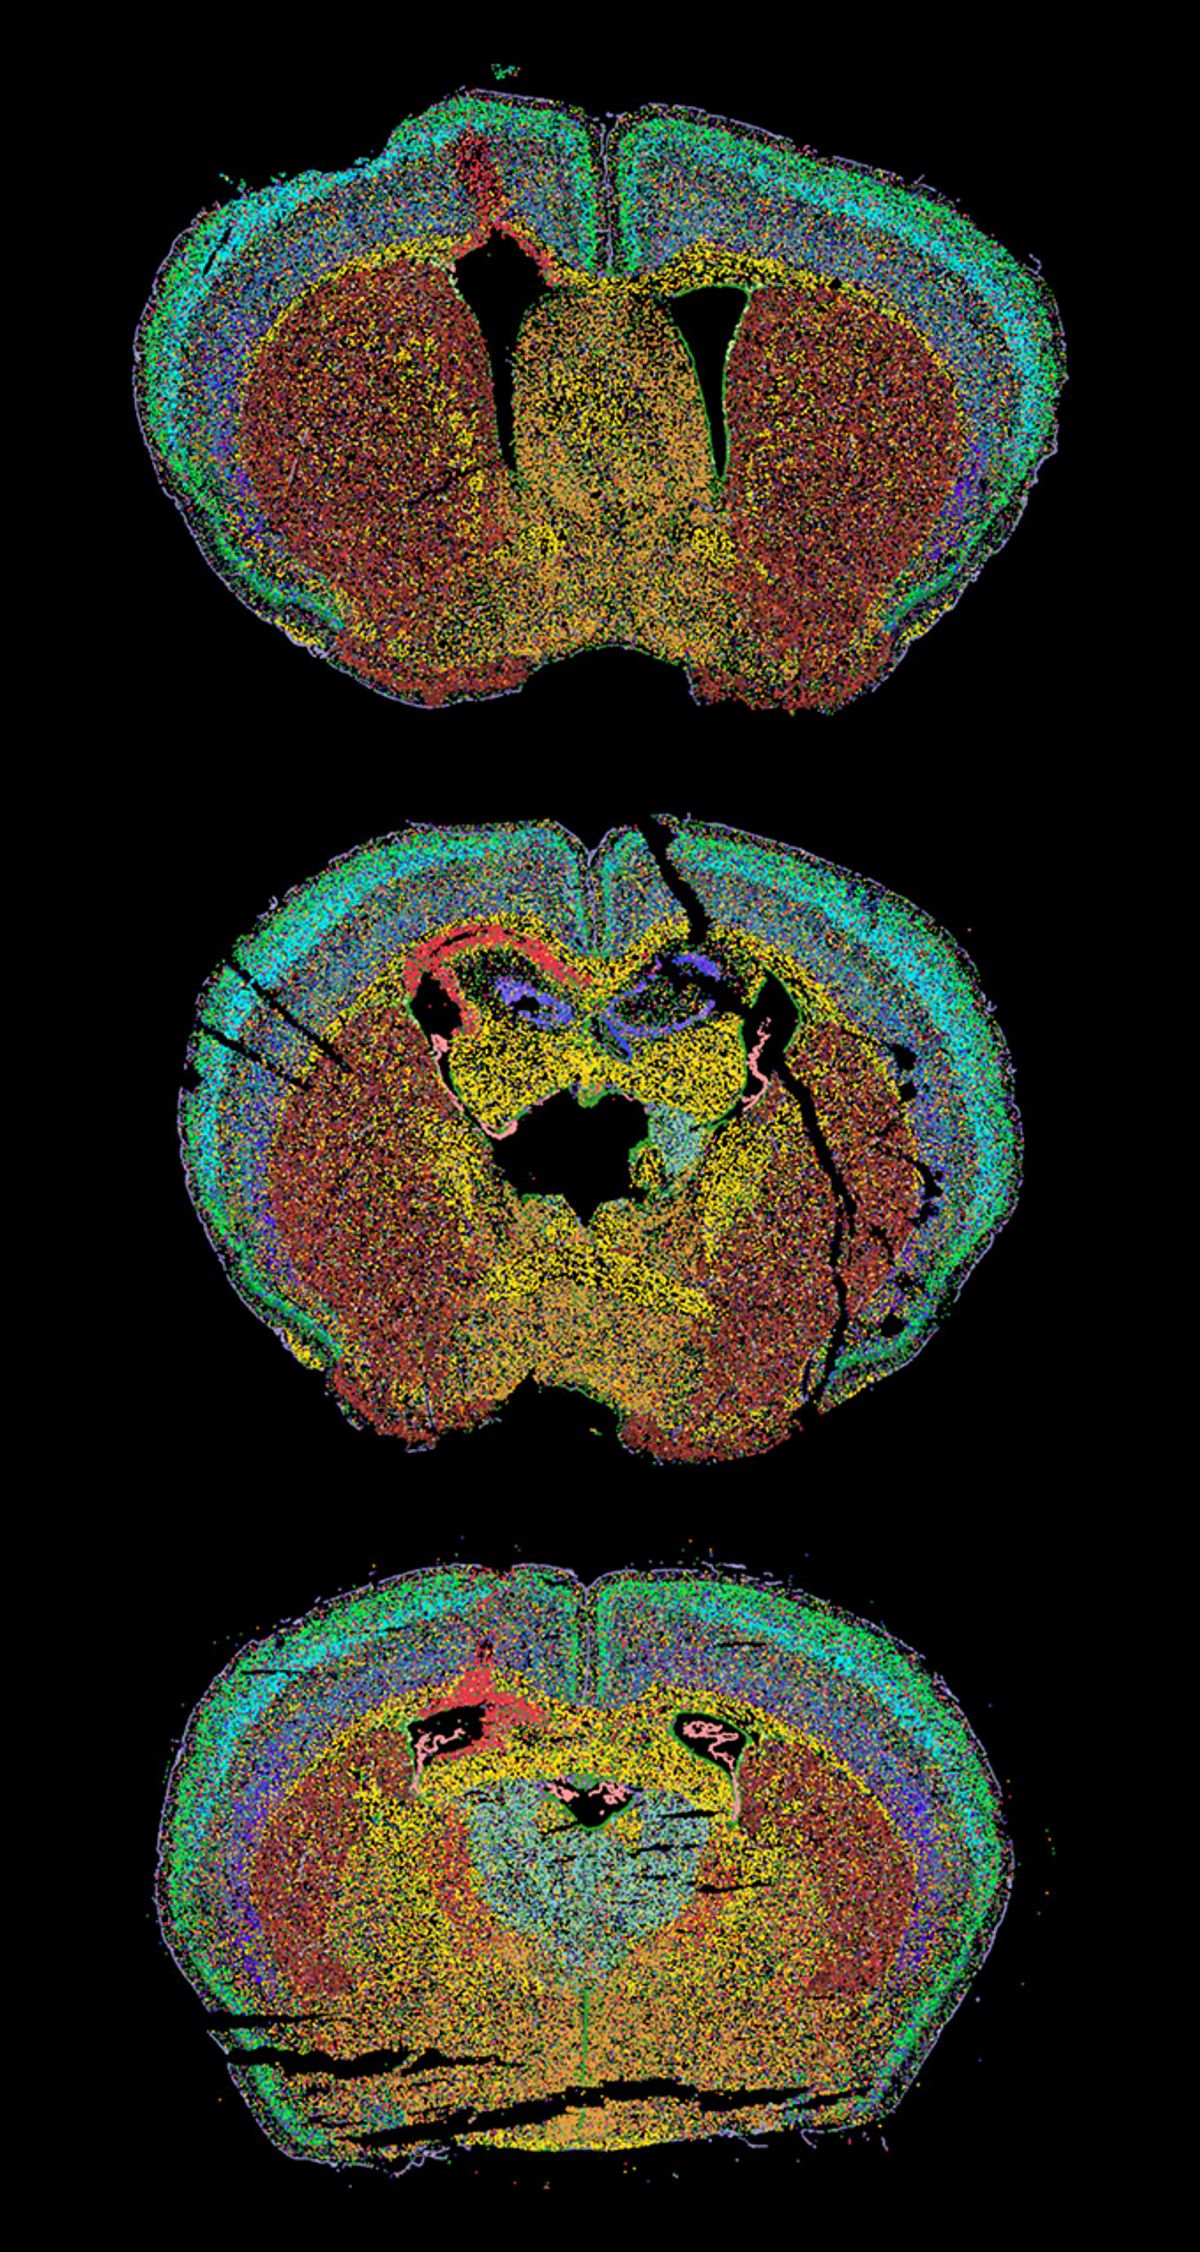
What are we seeing in this image?

This is a section of an injured mouse brain, and the image is a composite of the cell states. Using STcEM, we see brain immune cells, known as microglia, represented in red on the upper left side of the brain map. Together, the microglia changed both their shape and how their genes worked after an injury. We noticed that these cells contain tiny fat blobs, or lipid droplets, in the injured area. This finding helped us get a deeper understanding of microglia, instead of labeling them simply as “bad” or “good.” As we looked closer, we got a more complete picture of what these cells are and what they do.
How did you create this brain map?
STcEM blends two cutting-edge imaging techniques. First, SEM lets us see things up close, almost at an atomic level. Then MERFISH acts like a high-tech camera that counts up to 10,000 types of mRNA in a cell, all at once, with resolution scaling up to 100 nm from as small as one centimeter-squared tissue samples. It does this repeatedly by uniquely tagging each RNA, focusing on some labeled RNAs, taking a picture, and removing the labels. This is how each cell gets color coded, which is also based on similarities to their neighboring cells. Then STcEM is used to build this image computationally by pinpointing the RNA locations. For each dot, we used MERFISH’s fluorescent reporters to obtain detailed information about their transcriptome and each transcript’s location in the cell—whether they are in the nucleus or the cytoplasm. We then combined the spatial aspect further with SEM, which enhanced the resolution of the overall image. This resulted in a detailed story for the individual cells in the brain tissue, creating these beautiful images.
This generates a lot of data, so just one slice of the brain can produce approximately 4.5 terabytes. Analyzing these maps is a large-data approach for understanding the disease process of demyelinating brain injuries—how the disease functions, what causes the disease, and how we can stop it.
What did you learn using STcEM that you could not with SEM or MERFISH alone?
This combination of techniques in STcEM has many opportunities because we can now overlay cellular identities or infrastructural identities with SEM. This could be transformative because it provides an unbiased training data set for machine learning, which can understand specific transcriptional states that correspond to the SEM cell states.
STcEM is exciting because we see the expression of genes along with their functions. We see when the activated microglia do not contain lysosomes compared to when the cells are filled with lysosomes containing lipid droplets. When activated with lipid-filled lysosomes, they can migrate toward the injury and trigger phagocytosis. By analyzing the transcripts, the neuronal activation states can tell us which neurons received electrical impulses. And we are learning how to use these data to understand biology better and make a difference for patients.
By using the combination of ultra-detailed images from SEM and MERFISH, we have the opportunity to look at everything at once. Right now, we can examine every organ in a mouse, dive deep into each cell in the tissue, and see the difference between a cell’s healthy state and sick state—all in a few weeks.
See Also "A Complete Brain Wiring Map"
This interview has been condensed and edited for clarity.
Reference
- Androvič P et al., Spatial Transcriptomics-correlated Electron Microscopy maps transcriptional and ultrastructural responses to brain injury. Nat Commun. 2023;14:4115.


